AE AU AL forecast
The header display the time in UTC when the forecasts were issued. The forecasts are updated every minute, when solar wind data is available. The lead-time is indicated in hours and minutes.
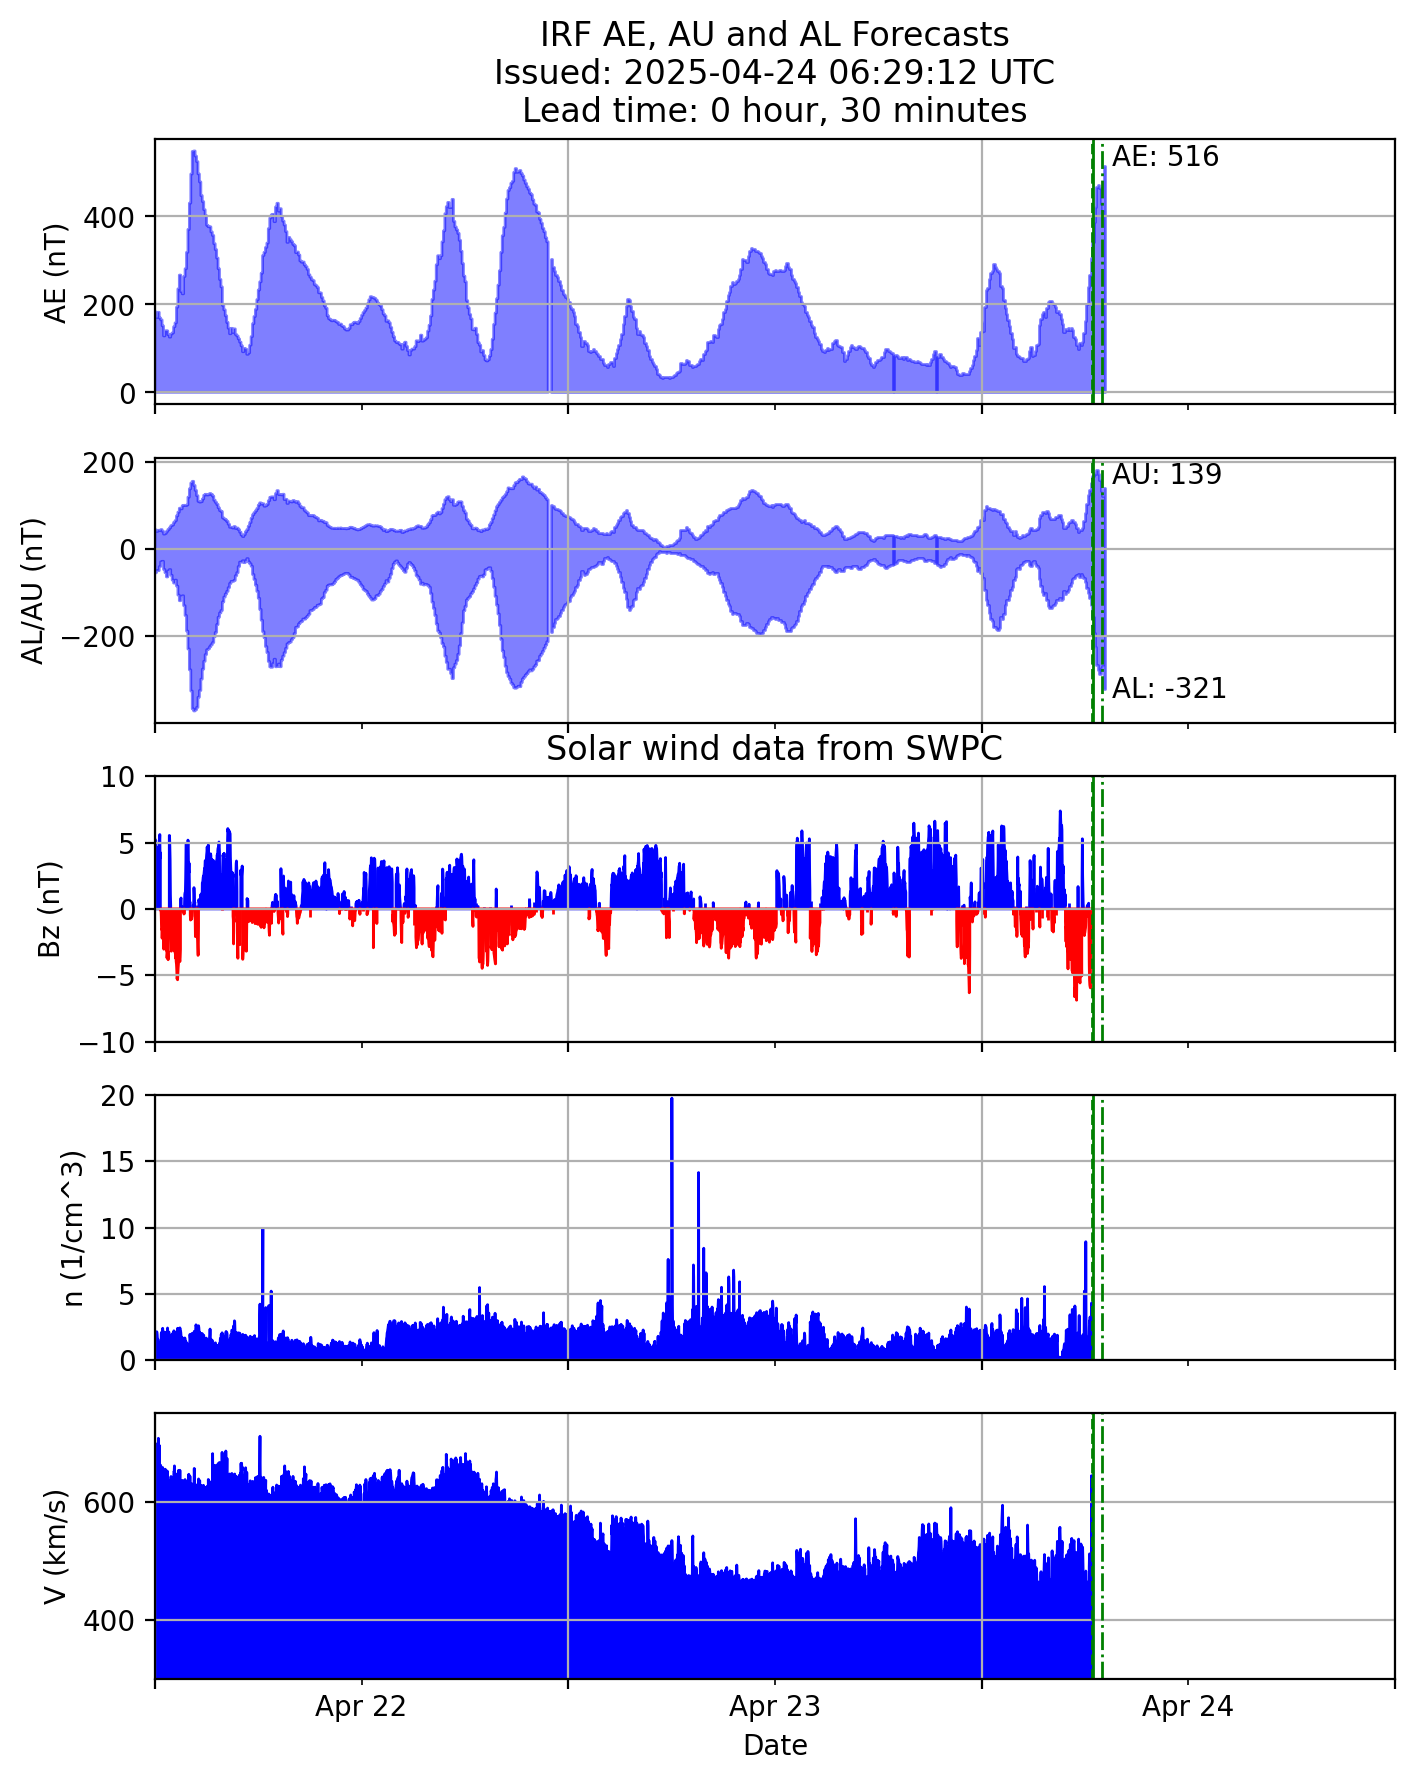
The top panel displays the AE forecast and the panel below displays both the AU and AL forecasts. Each bar has a width of 5 minutes and the plot extends over 3 days. The values for the latest AE, AU and AL forecasts are also shown after the last bar.
The bottom three panels display the measured 1-minute solar wind magnetic field Bz, particle density n, and speed V, respectively. As the largest storms are associated with negative Bz values. Positive Bz are shown in blue and negative Bz in red to make it clear when Bz is negative.
In each panel three vertical green lines are shown;
- Solid line marks the issued timestamp
- Dashed line marks the timestamp of the latest available solar wind data
- Dash-dotted line shows the latest predicted value.
The models
This product provides forecasts of the AE, AU and AL geomagnetic indices, as 5 minute mean values, using the IRF-AE-2020 model. The model contains three separate forecast models that were developed using neural networks and trained using each index and level 2 data from the ACE spacecraft. The models are driven by official real-time solar wind data from SWPC.
The lead time is typically between 20-110 minutes, with a median value of 60 minutes, but can sometimes be negative if solar wind data is missing. The official solar wind data consists of data from DSCOVR and ACE, where DSCOVR is the default spacecraft since July, 2016. During times of outages, coverage gaps, or problems with the data, SWPC may switch spacecraft.
The AE indices are derived at WDC in Kyoto, Japan, using geomagnetic variations in the horizontal component observed at selected observatories in the northern hemisphere. For each time stamp (in UT) the largest and smallest values are selected. The resulting time series constitute the AU (upper) and AL (lower) indices. They are a measure of the eastward and westward auroral electrojets, respectively. The AE index is the difference between AU and AL, and represents the overall activity of the electrojets.
References
- The real-time solar wind data are obtained from SWPC
- The AE indices are available from WDC
- The development of the AE forecast models was first carried out within the EU project PROGRESS, No. 637302, and then later within ESA contract 4000134036/21/D/MRP.
- The models have been implemented at the ESA S2P portal under G-ESC, where also past forecasts are available.