dB/dt forecast
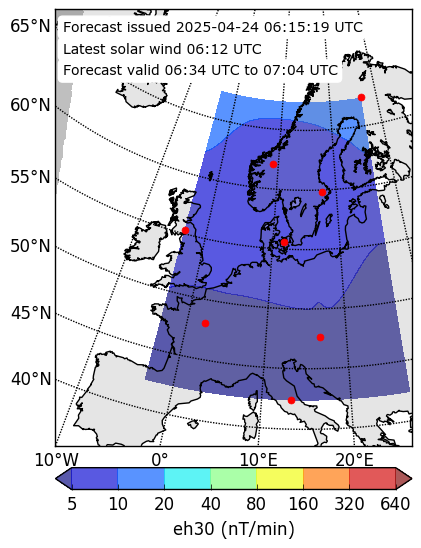
The map shows the maximum of 1-minute dB/dt magnitude over a 30 minute interval (eh30), where the interval is indicated by the Forecast valid range. The geographical extent is shown by the coloured region. The horizontal bar shows the colour coding of the different eh30 levels on a logarithmic scale in nT/min. The red dots mark the locations of the magnetic observatories that are targeted for predictions. The map also shows when the forecast was issued and the time stamp of the latest available solar wind data.
The models
The dB/dt prediction model consists of an ensemble of recurrent neural networks driven by measured solar wind at L1. The prediction lead time consists of the variable propagation time from L1 to Earths bow shock. The maximum prediction lead time is typically around 60 minutes but may vary from 20 minutes to about 80 minutes.
The inputs to the model are solar wind magnetic field B and Bz, density n, speed V, and time of day and time of year. The 1-minute solar wind data are transformed into 30-minute values (<em>not</em> just simple averages). The models are run once per minute thus providing 30 predictions for every 30-minute interval.
References
- The dB/dt-prediction models have been described in Wintoft et al. [2015].
- The relations between 30-minute maximum dB/dt, electric field, and GIC are described by Viljanen et al. [2015].
- The real-time solar wind data are obtained from SWPC.
- The geomagnetic data that were used for model development was obtained from World Data Centre for Geomagnetism, Edinburgh.
- The models have been implemented at the ESA SSA portal under the G-ESC.
- We are responsible for Regional Warning Center - Sweden, part of International Space Environment Service ISES.