Kp forecast
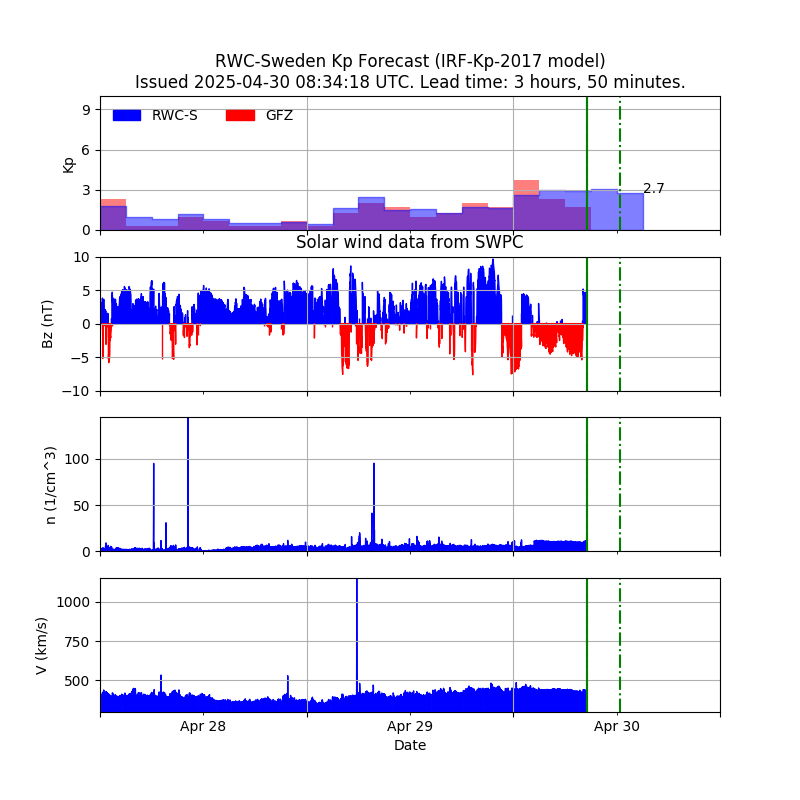
The top panel shows predicted Kp in blue (RWC-S) and observed Kp in red (GFZ) over the last three days. Each bar represents the 3-hour width of the Kp index. Attached to the last Kp bar is the latest predicted value. The green solid vertical line marks the time when the prediction was issued, with the timestamp shown in the header. The dashed vertical line marks the timestamp of the latest available input data. The dash-dotted line marks the timestamp of the latest prediction.
The three following panels show the solar wind magnetic field Bz, particle density n, and speed V measured at L1 with 1-minute resolution.
The models
The Kp predictions are generated from four different models with different lead times. Each model consists of an ensemble of time-delay neural networks driven by measured solar wind at L1. The prediction lead time has two components: a variable propagation time from L1 to Earths bow shock, and the model lead time. The four different models are targeted at 0, 1, 2, and 3 hours lead time. Thus, the maximum prediction lead time is 3 hours plus the propagation time.
The inputs to the model are solar wind magnetic field B and Bz (only Bz shown in plot), density n, speed V, and time of day and time of year. The 1-minute solar wind data are transformed into 3-hour values (not just simple averages) to match the 3-hour Kp interval. The models are run once per minute thus providing 180 predictions for every 3-hour interval. In the comparison with the observed Kp, only the predicted Kp with timestamp closest to the standard 3-hour Kp interval is used. In the plot, all bars showing predicted Kp, except the last bar, therefore comes from one prediction for each 3-hour interval. As the prediction lead time is variable and does not match the standard 3-hour Kp interval, the last bar corresponds to the 3-hour interval containing the last predicted timestamp. The last bar will therefore change in height during the passage of time.
References
- The Kp-prediction models have been described in Wintoft et al. [2017] and further verification in Wintoft et al. [2018].
- The real-time solar wind data are obtained from SWPC.
- The real-time Kp index is obtained from GFZ.
- The main development of the current Kp forecast models was carried out within the EU project PROGRESS, No. 637302.
- The models have been implemented at the ESA SSA portal under the G-ESC, where additional verification is carried out in real-time.
- We are responsible for Regional Warning Center - Sweden, part of International Space Environment Service ISES.